Tuesday, October 22, 2013

Supporting Kristi Lara & Questions for Miguel Solis

Kristi Lara  is by far the strongest candidate in the District 8 election due to both her positive abilities and support for students, parents, and teachers, and due to her concerns about actions taken by Mike Miles.   Too many questions remain unanswered about the apparently positive and blindly supportive relationship Miguel Solis enjoys with Mike Miles.  

Most professionals would probably support the majority of the reforms Mike Miles has both continued and initiated in DISD.  However, a painful minority of his other actions appear to be oblivious of the progress made since 2006.  He pushed many of the central leaders in DISD schools out, destroying too much of the ongoing critical progress being made since 2006. Mike Miles thereby specifically appears to be doing much damage, including repeating in Dallas the damage he did to student enrollment in Colorado.  Senior class enrollment has dropped by 530 students in the past year in DISD!

To secure specific opinions of Miguel Solis regarding this evidence and these practices by Mike Miles, the following questions were sent to him on 10-22-13.  

1)      Before he was hired in Dallas ISD there is no evidence that Mr. Miles was asked about the 26% drop in high school enrollment during the 6 years he was superintendent over Harrison School District Two in Colorado Springs.  During a time when elementary enrollment rose over 20% in Harrison, indicating families were moving into the district, this loss of high school enrollment is an exceptionally dangerous sign.  Does this loss bother you?  What does it mean to you?  Can you secure, or did you ever receive an answer from Mr. Miles as to what happened in Harrison to cause this student loss?   Are you comfortable with that answer?   Would you allow such a loss to happen in DISD?

2)     Mr. Miles is known for a policy of not allowing students to move to the next grade unless they can do the work well.   That policy would eliminate low scoring students, encourage students to transfer out, and encourage higher testing students to remain. Hundreds of students left Harrison and transferred to District 11 to the north where ACT averages then went down.  Is graduation a priority for you, or are higher average ACT scores a priority?  In what solutions to this issue would you place your energy?

3)     The majority of the above mentioned loss was to seniors.  The Harrison District senior class lost 33% of their enrollment during the 6 years Mike Miles was superintendent.  Now in Dallas, during Mike Miles second year in DISD, it appears the senior class has lost over 500 students compared to last year’s enrollment, over a 5.5% loss.  Does this loss bother you?  What accountability would you require from Mr. Miles if such senior enrollment loss continues?

4)     Mike Miles’ behavior necessitated a $100,000 investigation exposing many unethical actions by him against DISD policy, and against the board itself.  You have probably read that investigation.  What discipline would you have required as a board member?

5)     Mike Miles has alienated some of the most respected and accomplished leading education professionals in DISD.  It has resulted in many of them leaving their critical leadership positions as reflected in this article: http://dallasmorningviewsblog.dallasnews.com/2013/08/three-of-our-four-annointed-super-principals-have-been-drummed-out-of-disd.html/   Does this leave you comfortable about his leadership style?   What issues do you see?

6)     Mike Miles has had monumental difficulty in hiring and keeping staff who work closest to him in spite of the exceptionally high salaries he has given them: http://dallasmorningviewsblog.dallasnews.com/2013/05/when-will-disds-revolving-door-end.html/ .   What is your opinion of this turnover?  What issues does it present that you can identify?

7)     Mike Miles has paid some of the closest staff he had conflicts with to keep quiet. Are you comfortable with that?   What actions would you take, if any, to allow the board to freely speak with all such departing staff?  http://educationblog.dallasnews.com/2013/09/coggins-report-did-dallas-isd-superintendent-mike-miles-buy-former-communication-chiefs-silence.html/

8)    Miguel, you have said you support transparency.   Would you vote to require DISD to have the same level of transparency regarding teacher positions filled, and vacancies, as we now enjoy with student enrollment? (I am thinking of the enrollment listings at https://mydata.dallasisd.org/SL/SD/ENROLLMENT/Enrollment.jsp?SLN=1000)    That is, would you require that within the next working day every new vacancy would be public and listed online by school as well as totaled for the entire district?   This would allow the public to know exactly how many classrooms in their local school are not filled on any day with a full-time (not substitute) certified teacher for those students and subjects, as required by law.  How concerned are you about the record number of over 1,700 staff who have already left DISD these first 16 months of Mr. Miles tenure?  http://keranews.org/post/more-disd-teachers-resigned-year-last-and-some-say-mike-miles-why.

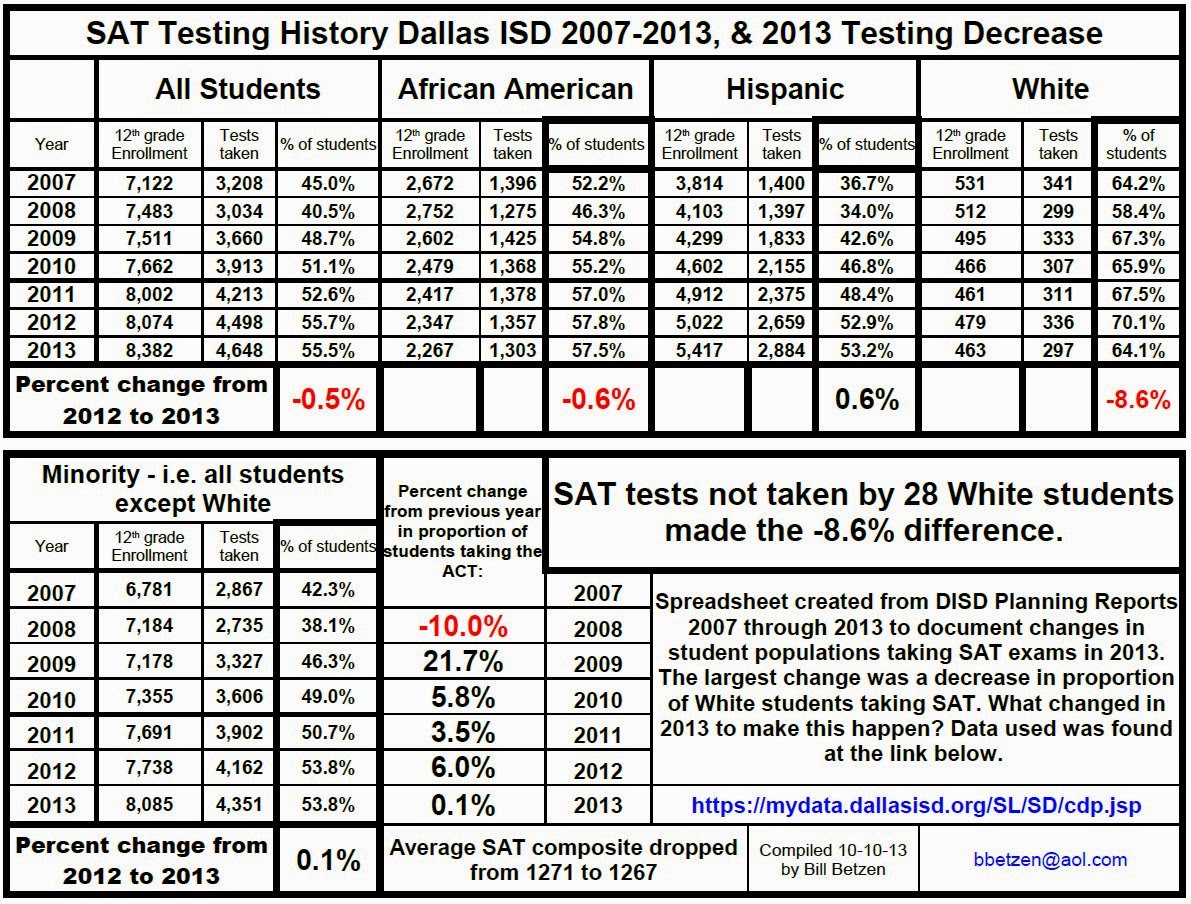
9)     In 2013, when reported at the end of July, DISD did not officially notify the board that, for the first time in DISD history, the proportion of DISD students taking college entrance exams went down.  The percentage of DISD Minority students taking the ACT exam fell by over 23% while that percentage was virtually unchanged for the SAT exam.   Does it bother you that Mike Miles did not point out these reductions in the student population tested to the Board?  Does it bother you that instead, through reports given, he claimed very questionable and unjustifiable student progress with higher average grades reported for the ACT? 

10) In 2013 Mike Miles decreased the public transparency relative to the average ACT scores reported to the public.  Historically they had been reported to the first place after the decimal point.  In 2013, due probably to the 23% decrease in the minority percentage tested, the scores increase from 17.2 to 17.6.   Then for the first time in history these results were reported to the nearest whole number only.   The result was that it appeared the scores went from 17 to 18 instead of  the 4/10 of one point improvement that actually happened.  Does that reduction in transparency bother you?  What do you think explains this? What would you have done if you were on the Board when such reporting was attempted with no clarification of the changes?   Nothing?

The responses of Miguel Solis to these questions will be posted here if and when they are received.   (as of 11-30-14 nothing has been received.)

Tuesday, October 15, 2013

Dallas ISD Graduation Rate Measurements Falling

The graduation rate for DISD is falling. The many measurements indicating this tragedy cannot be ignored.  Here is the spreadsheet with today's (10-15-13) enrollment numbers inserted.  The "official" 2013/14 enrollment numbers will be frozen in about two weeks.
Dallas ISD Enrollment 2002/03 to 2013/14
Click on above spreadsheet to enlarge and/or print.

Excel copies are available if requested from bbetzen@aol.com.

The 12th grade enrollment has fallen 5.5%, not going up for the first time in 7 years.  Instead our enrollment has fallen back 4 years to the level of the Class of 2010.  This is in spite of the fact that total DISD enrollment is up over 2,500 students.  The 12th grade enrollment is down over 500 students from last year! 

Since the original 9th grade enrollment for the Class of 2014 was over 1,100 students fewer than the Class of 2013, it is very probable that using the 9th grade cohort formula for graduation rate, once we know how many actually received diplomas for the Class of 2014, that there will still be a rise in graduation rate this year.  But please note that last year this 1,100 student difference in the 9th grade enrollment between these two classes had been reduced to only 116 students by the 11th grade due to the good work of 9th grade coordinators and DISD staff in general.  Now that 116 difference has exploded to over a 500 student difference indicating significant deterioration within the past year!

For the first time in 7 years the Cumulative Promotion Index has fallen for DISD!  The CPI measurement has fallen back to 2009 levels.  This most timely and predictive of all graduation rate measurements indicates the damage now happening by increased student attrition within DISD. A fall in the CPI indicates that somewhere along the 4 movements toward graduation (9th to 10th, 10th to 11th, 11th to 12th, and 12th to graduation) significantly fewer students were making the transition over the past 12 months since the official 2012/13 enrollment count.  Motivation is suffering. Parents feel abandoned by the schools.  Students are leaving as they reach senior year. 

We are in danger of loosing much of the progress DISD made over the past 7 years.   We must not repeat what happened in Harrison School District Two in Colorado where they lost 33% of their senior class and 26% of their high school enrollment over the 6 years from 2006 to 2012.  Their CPI fell 15 percentage points!

These numbers represent children.  In Dallas they represent many more hundreds of children, if not thousands.

Friday, October 11, 2013

Mike Miles' Resume & Worsening Student Attrition

Mike Miles Resume History Focusing on Student Attrition
Click on above image to enlarge.

Far too many indications are now appearing in Dallas ISD that the student attrition explosion that happened in Harrison School District Two in Colorado Springs under Mike Miles is now beginning in Dallas:
  1. For the first time since 2006 the senior class is not only not growing but it has shrunk over 6%.  The current loss is over 450 students!
  2. For the first time since 2009 documented discipline problems are going up and going up significantly with a 26% increase. Such changes usually indicate students will be leaving, as they left in Harrison.
  3. For the first time since 2006 the Cumulative Promotion Index (CPI) measurement, the most valuable of dropout rate predictors, has not improved but has actually gone down! With today's data it is calculated as 63.4%, but needs to be recalculated with the more offical enrollment data at the end of this month, the time of the normal annual count. This 63.4% is a drop of over two percentage points for 2013, back to pre-2010 levels! The CPI dropped over 15 points in the 6 years Miles was at Harrison.
These measurements are all predictors of a growing dropout rate and a shrinking DISD graduation rate for the first time since 2006!  See more data and details at http://schoolarchiveproject.blogspot.com/2013/05/damage-by-mike-miles-in-colorado.html .

To see the current reasons for alarm one only needs to compare the following 17 year enrollment by grade history of Dallas ISD with current enrollment.
Dallas ISD Enrollment by Grade from 1996 to 2013
Click on above chart to enlarge or print.
The current DISD student enrollment by grade, usually from the previous school day, can be found at: https://mydata.dallasisd.org/SL/SD/ENROLLMENT/Enrollment.jsp?SLN=1000

At the end of October, or the first week of November, this enrollment count is frozen to become the "official" annual enrollment count.  It then is used in the above spreadsheet and many others places as the official annual enrollment count.   Notice how the Class of 2013 had a 8,348 student 12th grade count which has now dropped to only 7,895 for the Class of 2014, a loss of 453 seniors as of today!  The 11th grade differences between these two classes was only 116 students.

The improving graduation rate with growing 12th grade classes since 2006 has suddenly ended! Why?

*****
Email bbetzen@aol.com if you want a copy of any of these spreadsheets to check, including the one not yet posted with the 2013/14 data as of today, used to get a CPI estimate of 63.4%.  It will probably change with the official enrollment counts at the end of the month, but not much. Critical readings are priceless for this work! Errors happen and must be minimized.

Wednesday, October 9, 2013

Does race guide how DISD treats students?

Are Mike Miles and DISD treating Minority students the same as White students? 

Here are two spreadsheets tracking the percentage of DISD senior class students taking college entrance exams going back to 2007.  They document almost constant increases in the percentages of students tested until 2013 when, for the first time, DISD paid for the SAT. The percentage of DISD students taking either college entrance exam went down!  They only went down 0.5% for the SAT, but they went down 21.7% for the ACT!

When you separate students by race the 2013 changes are dramatic.  While the percentage of Minorities taking the SAT saw almost no change, only a 0.1% increase, the percentage of Minority students taking the ACT went down 23.1%!  That reversed a 5 year history of constant increases averaging over 17%.  If only the same proportion of students as in 2012, with no increase, had taken the ACT, then 676 more Minority students would have taken the ACT in 2013.  That did not happen. 

With the normal annual increases, a total of over 1,000 more DISD Minority students would have taken a college entrance exam in 2013, but the numbers dived instead.  What happened?
ACT Testing History Dallas ISD 2007-2013
Click on above chart to enlarge and/or print
Email bbetzen@aol.com for a copy of either of these Excel Spreadsheets so you can check the data and formulas used in them.  Below is the same spreadsheet as the 2013 ACT centered report above, but it contains the data from the 2013 SAT testing data:
SAT Testing History Dallas ISD 2007-2013
Click on above chart to enlarge and/or print
The 23.1% reduction in the proportion of Minority students able to take the ACT exam represents a total of 676 minority students who did not have, for whatever reason, the advantage of taking the ACT.   The 8.6% reduction in the proportion of White students able to take the SAT represents a total of 28 White students who did not have, for whatever reason, the advantage of taking the ACT.

In a search for the answer to questions about equal treatment for all students, it must be asked what could have caused the massive reduction in Minority testing as reflected in these charts. Are Minority DISD students being treated equally?  What changed so suddenly?  Was this an attempt to raise grade averages?

Also, why, for the first time in history, was the ACT average reported in whole numbers in all of the 2013 planning reports for all the schools? (See https://mydata.dallasisd.org/SL/SD/cdp.jsp .) Was this an attempt to give the perception of grades going from 17 to 18, a full point, when the real average changes were only 4/10th of a point, or from 17.2 for 2012 to 17.6 for 2013?   Lessening the precision in these reports was certainly a step back in transparency.

Any claim that the 17.2 to 17.6 change is an improvement is erased by the 23.1% decrease in the percentage of Minority students tested.

What other questions need to be asked about these ACT/SAT testing patterns for 2013?