Saturday, January 22, 2011

Texas Education Progress endangered by planned 2011 Budget Cuts

Any failure to meet the additional costs for public education in Texas, due to inflation and normal student number increases, will end the accelerating progress Texas has enjoyed over the past four years. ( Click Texas Budget Surplus to see how costs could be met.) The failure to meet such cost increases will also endanger the progress projected by the increasingly rapid decrease in the 9th grade bulge found in Texas enrollment patterns. All progress will be in danger if the normal cost increases are not met. But the 11%-13% in cuts recommended in the Legislature will be an educational disaster for Texas children!

Patterns of progress over the past 4 years are clearly illustrated in the spreadsheet below.  It is a spreadsheet of enrollment by grade numbers for all Texas public schools.  It includes grades from 8th to 12th and graduation numbers from 1997 to 2010. It provides five measurements drawn from these enrollment numbers to track Texas educational progress:

Two measurements in this spreadsheet are related to the 9th grade bulge.  They measure it from both incoming and outgoing student numbers. As the percentage of 8th grade enrollment reflected in 9th grade enrollment grows, the bulge is disappearing. As recently as 2008 Dallas ISD had 9th grade enrollments that were over 35% larger than their 8th grade enrollments. Students were "stuck" in the 9th grade, repeating it more than once until they either pass on to 10th grade or dropout. The second "9th grade bulge" related  measurement counts the percentages of 9th graders who pass on to 10th grade the next year. In too many school districts the majority of dropouts never make it to the 10th grade. In Dallas ISD we had years as recently as 1999 when less than 60% of 9th grade enrollment was reflected in the next years 10th grade enrollment. This year, 2010-2011, the DISD 10th grade enrollment is over 82% of last year's 9th grade enrollment, the highest percentage on record for recent decades! As the 9th grade bulge disappears dropout rates will continue to go down.

The data above was used to create the following graph on each of the five measurements to more clearly document progress.  Notice especially the most recent Cumulative Promotion Index (CPI) measurement clearly illustrated in the graph below for the Class of 2009. This 5.9% CPI is almost double the second strongest improvement (3.2%) for any of the CPI rates that preceeded it in this chart covering 12 years! Texas is headed in the right direction!

The Cumulative Promotion Index (CPI) is a measurement more frequently found in academic circles, but it is a very solid predictive measurement for the direction that graduation rates are going. It takes the measurements from the same four transitions gathered in the graduation rate that normally follows only one group of students over the four transitions toward graduation: 9th to 10th grade, 10th to 11th, 11th to 12th, and 12th to graduation.  The CPI takes the measurements from these same four transitions but from four different student groups making those transitions within one 12 month period.  Thus the CPI for 2009 measures the transition of the 9th, 10th, and 11th grade classes of 2008-2009 to the next grade in 2009-2010, and the transition of the 12th grade class of 2008-2009 to graduation.  The CPI graduation rate measurement is more timely, and also more predictive due to the fact that three of the four groups measured will be graduating at some time in the future.

The projected progress in Texas seen in the 5.9% improvement in the CPI will continue to happen unless there is a significant disruption in the funding of educational services provided to children. To continue the current progress cost increases due to growing student numbers and inflation must be met. But the 13% cut now proposed in the Texas Legislature will be a disaster! It shows no awareness by the lawmakers who are supporting such recommendations of what is happening both in Texas schools, and in the criminal justice system. Where on the priority list for each of these legislators are the children of Texas?

A 5.9% improvement in the Texas graduation rate would mean that over 18,000 more students are receiving a high school diploma. If that were not happening, what would the ultimate cost be to Texas for 18,000 more citizens without diplomas?

The normal high school graduate makes $10,000 more in annual income than the normal high school dropout. With 18,000 more citizens paying taxes as they spent that average $10,000 extra in annual income for 30+ years that would amount to $5.4 billion dollars more in spendable income in Texas. (18,000 x $10,000 x 30 = $5,400,000,000)  This 5.4 billion dollars comes from a 5.9% increase in graduation rates being achieved for only one year. Add to that number the savings due to decreased law inforcement, less incarceration, and other social costs saved when students graduate and do not drop out.  Money invested in education is the best investment. 

Copies of the spreadsheets used in these calculations are available by request. All data used in these calculations come from the TEA web siteChallenges to this data, and these conclusions, are welcome!

Bill Betzen
bbetzen@aol.com
http://www.studentmotivation.org/

Friday, January 21, 2011

Texas Education Progress and 2011 Budget Crisis

The currently proposed education budget reductions of 13% now being considered in the Texas House of Representatives will have terrible consequences! There are 4,850,000 children in the public schools of Texas. The current recommendations, if followed, would amount to one teacher, or other school employee, loosing their job for every 50 public school children in Texas.

Such drastic cuts would certainly have a very negative affect on education in Texas!

Below is one record of the progress made by our children in Texas over the past dozen years.  It is an enrollment by grade spreadsheet for all the public school children in Texas showing their progress toward graduation. (Click on the spreadsheet to make it larger.) Significant improvements have happened during these years:
This spreadsheet clearly shows wonderful progress by our children.  Yes, the percentage of 9th graders who are getting a diploma within 4 years is embarrasingly low, only 67.4 percent by the most recent numbers available for the Class of 2009. But that is a 5% improvement from 8 years before.  Please notice that in all major categories Texas is improving!  Also, it is indicated that more improvements were on the way.  The notorious 9th grade bulge, where 9th graders get stuck repeating the 9th grade, and too often just drop out, is shrinking. That indicates that the graduation rate in two years will continue to rise. As dropout rates go down so do crime rates. But, with this dramatic budget cut, and the loss of teachers, will this progress continue to happen?  (Please email bbetzen@aol.com if you want a copy of this Excel spreadsheet to work with.  Data is all from the TEA web site.)

There are many issues.  Public availability online of itemized budgets for every publicly funded service in Texas should be mandatory. This includes every school and school district, as well as roads, medical funding and all other services paid for by taxes. All the details should be easy to locate and understand online so the public can see how their money is spent.  They certainly should voice opinions on cuts to make, or else decide on how to provide better for our children and find the money/resources needed.

Texas has constantly been improving the education of our children.  That can continue if we make the needed sacrifices. What else in the budget could more directly change the future of Texas than investments, or the failure to invest, in our children?

Monday, January 17, 2011

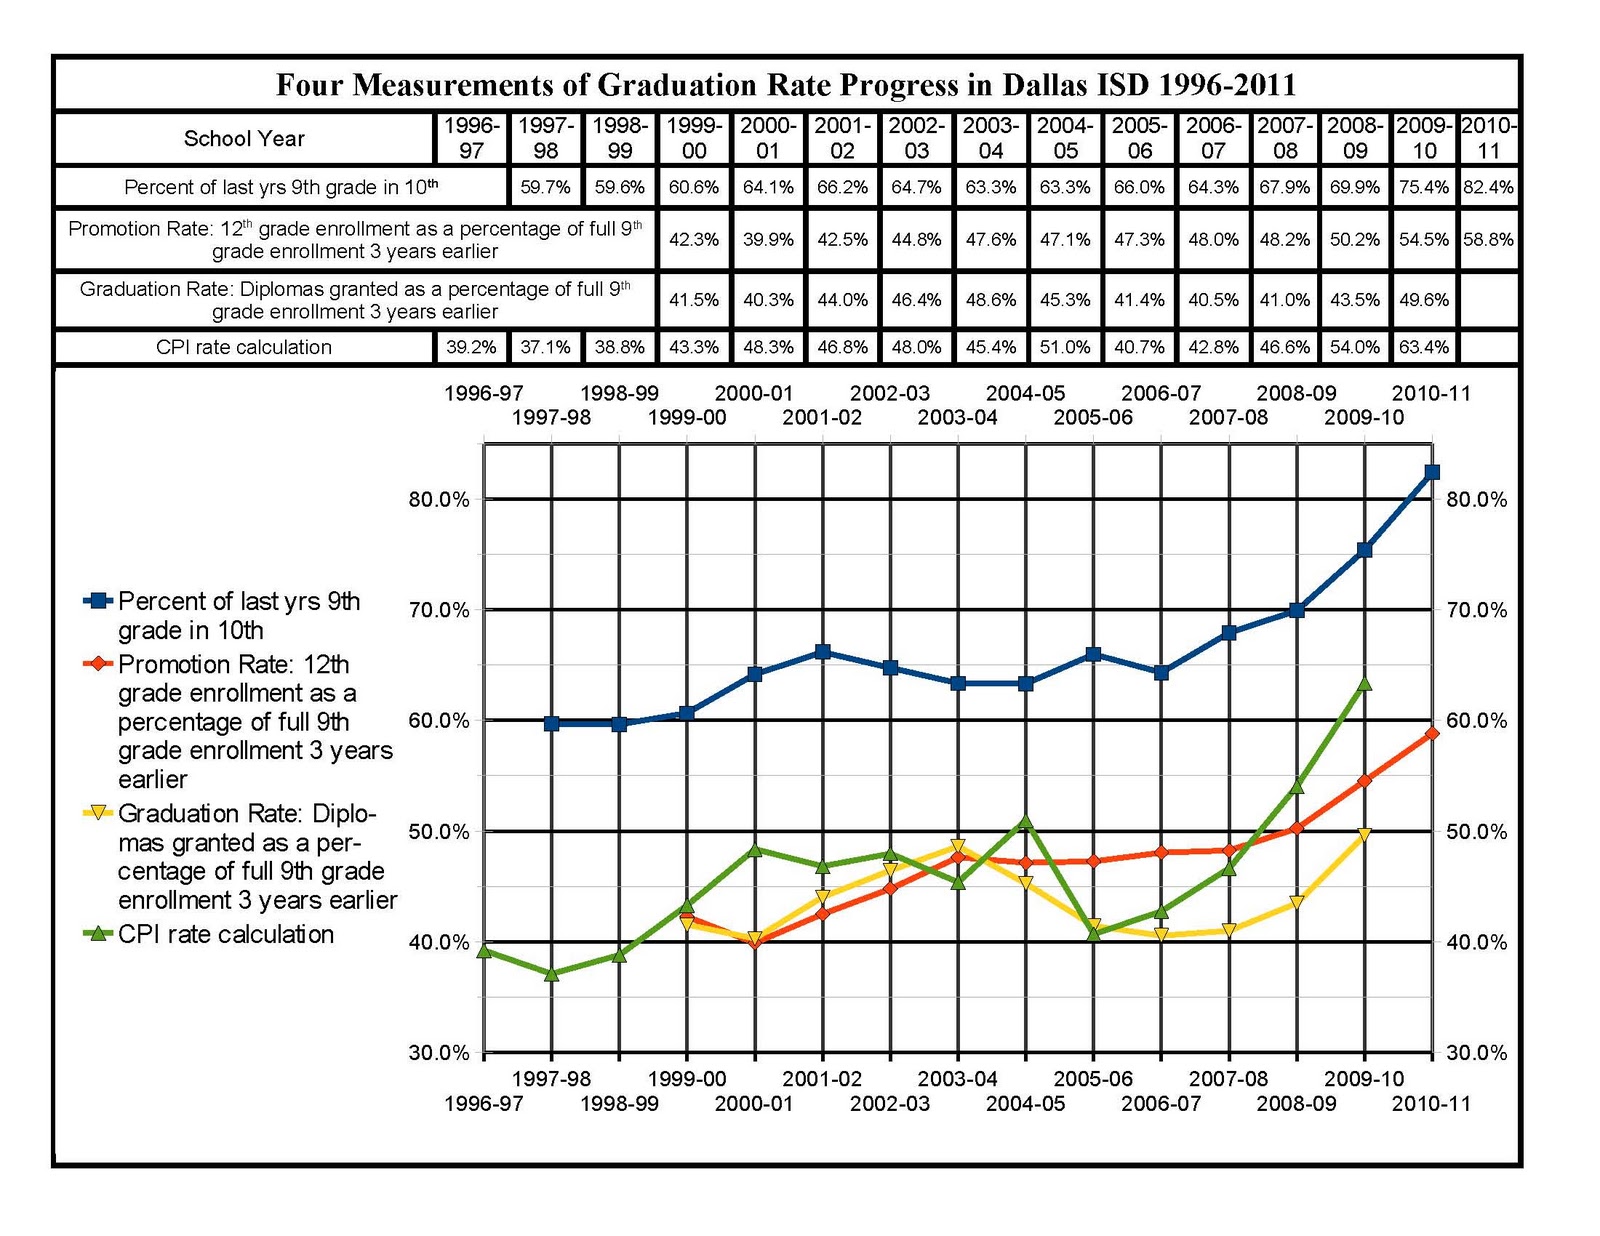
Four Measurements of Graduation Progress in Dallas ISD 1996-2011

Understanding the true graduation rate in Dallas ISD is critical to understanding what is happening to Dallas children. The first draft of the graph below was produced over a year ago to help clarify the issues relating to graduation rates. It tracks four critical measurements related to graduation rates within DISD. Now, with this 2011 version, each measurement is updated with one more year of data. The ongoing progress by DISD is shown in this graph. Each measurement improved a minimum of 4.3 percentage points to as much as 9.4 percentage points!

These are the four measurements used in this chart:
  1. The percent of the previous year's 9th grade enrollment reflected in this year's 10th grade enrollment is a way to track the notorious "9th grade bulge."  This "bulge" is an inflation of 9th grade enrollment caused by students who are "stuck" in the 9th grade, repeating it until many of them simply drop out.  This bulge goes down as a greater percentage of each 9th grade's enrollment moves to the 10th grade.  The shrinking of this bulge is a predictor for higher graduation rates. In the past the majority of students who dropped out of DISD were those students who also never made it to even enroll in the 10th grade. That is now changing with the largest 10th grade enrollments in history happening in 2010-2011! 
  2. The promotion rate is a measurement of the percentage of students who successfully make the first three transitions in high school: going from 9th to 10th, 10th to 11th, and 11th to 12th. It is a measurement used in many national studies, such as the John Hopkins University "Dropout Factory" study.  It is used due to the difficulty of securing consistent graduation information from each high school across the nation. The 2007 John Hopkins University study declared all 21 non-magnet high schools in Dallas as part of the 2000 schools in the U.S. to be "Dropout Factories" with promotion rates of 60% or below from 2004 to 2006. Now 1/3 of these DISD schools are no longer "Dropout Factories."  More progress is anticipated due to the current 70+% reduction of the "9th grade bulge."  That reduction improves the potential that more students will be making it to 12th grade and on to graduation.
  3. The graduation rate used in the chart is the percentage of full 9th grade enrollment reflected in enrollments for each of the three transitions mentioned above, plus the number of diplomas represented in the final transition from 12th grade to actual graduation. Please note that this graduation rate percentage has been growing more rapidly than the promotion rate since 2007. That indicates that more students are passing the relatively recent hurdles presented in the final year of school with more rigorous state testing since 2004.  This is very positive progress!
  4. The CPI rate calculation is the Cumulative Promotion Index used in academic circles as a more timely measurement of the progress being made in a school system.  It takes the four transitions of the graduation rate described in number three above and compresses them into one 12 month time frame involving four different student groups. For the Class of 2010 the CPI was made up of the percentage of freshmen failing to transition that year (2009-2010) to be sophomores the next school year (2010-2011), the percentage of sophomores who failed to transition that year to be juniors the next year, the percentage of juniors who failed to transition that year to be seniors the next year, and finally the percentage of seniors who failed to graduate with the Class of 2010.  That sum, subtracted from 100%, is the CPI. The CPI is a more predictive measurement because it measures the percentages of students-yet-to-graduate who have already successfully managed three of the four transitions counted in a graduation rate. If a CPI measurement is going down it is a warning signal as well for worse dropout rates to come. In this case DISD has reason to celebrate as the CPI is going up! We must then keep working for an ever higher graduation rate.
If anyone wants copies of the spreadsheets and data sources used to create this chart, please email bbetzen@aol.com.  Critical readings of the data are welcome!  All data comes from publicly available sources, mostly TEA.  The only data no longer easy to locate online are the enrollment by grade counts for DISD schools as of 11-05-10.  These were used as the source for current enrollment numbers for the 2010-2011 school year.  They are probably the most error prone of any numbers used to create this chart.  They are still probably well over 99% accurate as a projection of the "official" enrollment counts that should appear on the TEA web site within the next 4 months.

Sunday, January 16, 2011

Graduation rate progress by area in Dallas ISD

Dallas media has often written stories giving false impressions that the dropout problems in Dallas are on the south side of Dallas. In 2008 that presumption was documented as being false!  That year the promotion rate, and potential for graduation, for high school students continued to be higher in the 9 Oak Cliff DISD high schools than in the 6 North Dallas DISD high schools. That was the third year that was true.  The difference had grown to one of 10.1 percentage points in 2007-08!! The 9 Oak Cliff high schools had 10.1% more of their 9th graders making it to12th grade! This measurement is called the promotion rate.

The promotion rate is composed of the first 3 transitions of the 4 transitions that combine to make the full "graduation rate."  The promotion rate combines the transitions from 9th to 10th, 10th to 11th, and 11th to 12th. The last step toward actual graduation is not included in the promotion rate calculation.  That fourth step with graduation data is hard to collect nationally on a consistent basis state to state.  Thus, progress in raising the promotion rate only points toward graduation rates also going up and is not an absolute predictor.  But it has been an accurate predictor for the DISD graduation rate progress in recent years.

The 9 Oak Cliff high schools in Dallas ISD continue to hold the lead over the other areas of Dallas ISD with the highest combined promotion rate in 2010-2011.  They have the highest percentage of their 9th grade enrollment reflected in the full ultimate enrollment for the 12th grade three years later. However, they are only 3/10ths of one percent in front of the 6 North Dallas high schools. It is possible that in 2011-2012 North Dallas will pull in front of Oak Cliff for the first time in 8 years.  This competition and progress is good news for all of Dallas.  In this process the promotion rates for all areas of DISD have gone up 4 percentage points, or more, this year!  Look at the chart below to see how all of DISD is improving.

Copies of the spreadsheets used to create the above graph are available.
Please email bbetzen@aol.com.

Sadly, promotion rates are the only calculations possible by school from the online TEA database. Due to lack of such consistent graduation data nationwide, it is the measure the national John Hopkins University "Dropout Factory" study was forced to revert to using, and which has been repeatedly mis-interpreted as a "graduation rate" by the press nationwide. The TEA online database, and all similar state accountability systems in the nation, must provide graduation numbers by school.

Annual enrollment data, combined with graduation data, should also be placed annually into one multi-year spreadsheet for each school and school district so as to show student movement. This only amounts to the annual collection of 16 numbers: Early Education, Pre-K, Kindergarten, the 12 grades, and the number of diplomas granted that year. These 16 numbers collected for each school and school district each year, and added to the same spreadsheet each year, would lead to a revolution in public accountability and transparency. Seeing the patterns these 16 numbers form, when placed into the same spreadsheet with the same 16 numbers for each year going back 20+ years, can tell you more about a school or a school district than any other single sheet of paper. Such spreadsheets help parents and politicians to better understand the meaning of a "20% dropout rate" claim when 50% of the 9th grade enrollment three years earlier is missing at graduation for that acclaimed "20% dropout rate" class. Such spreadsheets may eliminate such misleading dropout rate claims.

Such transparency is mandatory!  It is leads to public accountability that is long, long, overdue. It makes it harder to hide children who are "missing at graduation."  It helps people know that questions need to be asked.

Thursday, January 6, 2011

Sunset High School made Dallas ISD Class of 2010 graduation rate record possible

The Dallas ISD Class of 2010 set a graduation rate record going back over 20 years. The 6,984 diplomas given out in 2010 represent 49.6% of the full 9th grade class enrollment from four years earlier, when that enrollment was 14,079. This measurement of graduation rate has not been higher than 49.6% in over 20 years. (The measurements used in this calculation are not to be confused with the TEA graduation rate calculations, the AYP calculations, nor the Cumulative Promotion Index measurement for graduation rates.)

However, when you remove the tremendous progress made by Sunset High School in Oak Cliff, this wonderful 20+ year record almost disappears to only a 6 year record.   The 49.6% DISD graduation rate goes down to 48.9%.

Sunset High School has made over a 150% increase in their graduation rate since the Class of 2000!   The large majority of this progress was achieved since the Class of 2006, as shown in the graph below.   This report is a comparison of Sunset progress with the progress within all of the rest of Dallas ISD, without Sunset. Just click on the image to see a larger copy.

It appears that almost all the progress within Dallas ISD is happening within Sunset based on this chart.  While it is certain this is not true due to the wonderful progress eliminating the 9th grade bulge throughout DISD, it is certain that Sunset is a leader among the 40+ high schools in DISD. Below is an enrollment by grade chart for Sunset going back to 1997 which clearly shows the 9th grade bulge has virtually disappeard this year at Sunset. When both Sunset and Greiner Middle School, the other middle school feeding into Sunset, started their own School Archive Projects the summer of 2009, that meant that all students at Sunset were getting that forward looking and planning experience twice at a minimum.


Hopefully this progress within Sunset is being studied by Dallas ISD, and the results of those studies will be shared with the public. The reasons for this tremendous progress need to be known.  This dramatic progress must be repeated in all DISD non-magnet high schools.

Most of the data from which this chart was made is available at http://www.studentmotivation.org/DallasISD.htm, and on the "DISD Stats by School" pages linked from that page.  Questions about this data are welcome.  Copies of more recent spreadsheets, used in these calculations but not yet online, will gladly be shared.  Just email bbetzen@aol.com.

Wednesday, December 29, 2010

School Archive Project 2010 Annual Report

Year 6 of School Archive Project shows real progress!!

Click on the above chart to see a larger copy, download, and/or print a copy.

  1. Dallas ISD set a 20 year graduation rate record in 2010.  The high school which contibuted the most to this progress, out of the 40+ high schools in Dallas ISD, is also the high school which received the large majority of School Archive Project students. DISD had an 9 percentage point graduation rate increase from 2007 to 2010. (Improvements are summarized in a 12-13-10 opinion piece published in the Dallas Morning News as “A teacher's report card on Michael Hinojosa.”) However, Sunset's graduation rate went up 25 percentage points during the same 2007-2010 period within which DISD improved "only" 9 percentage points.
  2. The School Archive Project has gone from starting in one school in 2005 to now being in 7 schools at the end of 2010: two high schools, four middle schools, and one elementary school.
  3. The money donated to install ten School Archive Project vaults is almost gone. The Dallas Educational Foundation (http://www.dallaschamber.org/index.aspx?id=CurrentFundedPrograms ) needs more donors to replenish the School Archive Project Fund. This fund provides a $1,500 grant to each DISD school starting a School Archive Project. Over 3,000 DISD students a year are now writing letters to themselves planning for their own futures.  These letters are placed by the students into the vault bolted to the floor in their school lobby where the letters stay for the next decade. This 3,000 number needs to grow ten-fold so that more DISD students are actively involved in documenting plans for their own futures.
  4. Sunset High School, which has received the majority of School Archive Project students since 2005, has gone from one of the lowest average graduation rates within DISD, only 34% (2000 to 2007), to one of 60% for the Class of 2010, which is over 11 percentage points higher than the DISD average. Sunset will have a graduation rate of 70% by 2013 based on current patterns reflected in their spreadsheet below. Sunset High School received a dynamic principal, Tony Tovar, about the time that the School Archive Project started. He gathered many talented staff and well designed programs into Sunset, including starting a high school version of the Archive Project with their own vault in 2009. The other middle school feeding into Sunset, Greiner Middle School, started it's own Archive Project the summer of 2009 as well. (Click on the "DallasISD Graduation Rate Progress" chart above to enlarge it and study the details of the dramatic progress happening, especially since 2009!)
  5. The most significant modification of the Archive Project happened in 2010. Parents now start the letter writing process for their child by writing a letter to their child. They write about their dreams for their child. The student then reads and uses this letter to help write their own letter to themselves about their dreams and plans for the future. Both letters go into the same self-addressed envelope that the student then places into the vault for the next decade. It is certain these 10-year class reunions will be even more powerful for former students due to the priceless additional letter from their parents that will be waiting, with their own letter, in the School Archive.
The Archive Project progress has been accelerating and expanding. The 60% graduation rate is cause for celebration! Now to go far beyond it!

The dedication of the volunteer staff running the School Archive Projects in each school is to be acknowledged and honored.  Each school has from one teacher to a team of such volunteers who run the Archive Project. They alone allow for the low $1 per student Archive Project cost.

We still need to get university-based research started into the validity of the dramatic achievements that appear to be happening in association with the School Archive Project. Hopefully such research will start in 2011 as the number of students reached by School Archive Projects continues to increase.

Please make a donation to the Dallas Educational Foundation if you would like to help more schools start a School Archive Project. This can be done at http://www.dallaschamber.org/index.aspx?id=DallasEducationFoundation. You may also simply contact your local school and offer to directly finance their starting a School Archive Project. A 500-pound vault can be delivered and installed for about $1,100 to function as the time-capsule. The school only needs one or more volunteer teachers to run the project, teachers who would love to encourage student writing and planning for their own futures.  Teachers who would most love to see their students again in 10 years are recommended.

Friday, December 3, 2010

"Dropout factory" definition error by Dallas Morning News & other media

A major error in the definition of “dropout factory” is being made by many news organizations across the US leading to significant errors in judgement regarding actual progress. That error mistakenly included in the "Dropout Factory" definition the last of the four critical steps high school students make on their way to graduation, the move from 12th grade to actually getting a diploma.  The "Dropout Factory" definition only counts the first three moves: 9th to 10th, 10th to 11th, and 11th to 12th. It does not count the move to graduation as graduation data is very difficult to consistently secure on a national basis.  This fact, combined with monumental increases in the Texas 12th grade dropout rate since 2006 due to raising graduation standards, is the reason that Texas, while leading the nation in loosing 77 "Dropout Factories," still had a decrease in the Texas graduation rate of 0.4%.

In Dallas this error was made by the Dallas Morning News on 12-4-10.  That error can be found online with the posting of “Hits and Misses” . That posting includes the following statements: "The state has considerably fewer "dropout factories" than eight years ago. That's the result released this week by America's Promise Alliance and several other organizations that have studied dropout patterns across the country. In 2002, 240 Texas high schools qualified as dropout factories, meaning that 60 percent or fewer of their students graduated."

The "dropout factory" term was defined John Hopkins University in their historic 2007 study.  It does NOT refer to schools wherein "60 percent or fewer of their students graduated." It only counts students who make it from 9th grade to 12th grade, not those who graduate.

On page 24 of the “Building a Grad Nation report," linked from http://www.americaspromise.org/Our-Work/Grad-Nation/Building-a-Grad-Nation.aspx , the definition of “dropout factory” is clearly given. Graduation data is much harder to collect on a national scale and therefore was not used in the “dropout factory” definition. Instead that definition is based on the "promotion rate."  That is the percentage of 9th grade enrollment reflected in the 12th grade enrollment three years later.

For Texas, in 2002, 2003 and 2004, almost all seniors graduated. This change in definition by the Dallas Morning News makes little difference in such years. Only 0.7% of the original 9th grade enrollment were missing for the Class of 2002. Those years the 12th grade enrollment and the number of diplomas given out in Texas were almost equal. In 2004 Texas actually gave out about 800 more diplomas that it had 12th graders listed as enrolled. Those are the numbers reflected in the TEA (Texas Education Agency) data base. (See this history and data in a spreadsheet of Texas State Enrollment by Grade just over half way down the page at http://www.studentmotivation.org/DallasISD.htm.)

By 2008 in Texas this situation had dramatically changed. Texas had wisely implemented more meaningful graduation requirements. By 2008 the percentage of senior enrollment “missing at graduation” had gone up over 10-fold from 0.7% to 7.85%! Thus 21,485 Texas seniors of the 273,606 seniors in the Class of 2008 were “missing at graduation.” These dropouts are not counted by the “dropout factory” definition erroneously being used by the Dallas Morning News and other media. (Statistical data used in these calculations is secured from the Texas Education Agency web site at http://ritter.tea.state.tx.us/adhocrpt/Standard_Reports.html .) That is why this newest America's Promise study reports on page 27 that, in spite of Texas leading the nation with 77 fewer "dropout factories," Texas had a graduation rate that went down 0.4% from 2002 to 2008, instead of going up.

Yes, Texas is still making progress. We now have more accurate data available. We also must have the more demanding standards for graduation that were implemented after 2004. But we are not making progress when the media are less than precise in the way they report on that progress and the data available. We must practice the same accuracy we want our students to master. The Dallas Morning News needs to correct this error.

It needs to be emphasized that this error by the Dallas Morning News is repeated across the US by several other news organizations.  Too many news media staff are not familiar with the definitions involved. This is another issue we face in the battle fighting very real, and very high, dropout rates across the nation.