
This review uses
data from the Texas Education Agency Snapshot pages for 2014 and 2015, online
at http://tea.texas.gov/perfreport/snapshot/index.html. This data is inserted below in three three-pages
containing all 98 data items from each year for all charter schools and ISD’s
in Texas, and for Dallas ISD, for these years. Items that are identified as
more significant have an “X” to the far right.
Here are some of the more critical items. They are identified with the number in the
far left-hand column of the spreadsheets, starting with page 1 below.
Items 3
through 16 cover basic demographic information. While economically
handicapped minority students are over represented in charter schools, items 6
and 11, this is mainly due to the fact that charters collect in urban, high poverty areas. Within those urban areas they focus on areas like District 6 here in southwest Dallas where about 50% of school attendance is in charter schools.
Items 18, 19
and 20 indicate that the charter dropout
rate is over three times that for ISD’s while charter graduation rates are
between 20 and 30 percentage points worse than ISD’s.
The
percentage of charter students passing all statewide tests, item 23, remains
about 2 percentage points lower than in ISD’s in Texas.
On page 2 below,
item 36 indicates a positive trend in charter school of higher percentages of
children classified as economically disadvantaged & passing all statewide
tests.
 |
| Page 1 summary Texas Education Agency Snapshot Data for years 2014 & 2015 with Dallas ISD |
Items 37
through 40 indicate that while between 17 and 20 percent less charter school
students are taking either ACT or SAT tests, this select group is still testing
below the ISD students for Texas.
Items 43 and
44 indicate that charter schools invest about twice as much in administrative
and leadership positions in their schools.
Item 46 indicates they spend over 5% less in teachers.
Item 52 shows
that the average charter teacher salary is $6,000 less than the average ISD
teacher salary while the charter teacher has an average of between 1 and 2 more
students in each charter class, item 55.
Items 56 and 57 show ISD teachers have over twice the average teaching
experience of a charter teacher and less than half the turnover.
 |
| Page 2 summary Texas Education Agency Snapshot Data for years 2014 & 2015 with Dallas ISD |
On page 3 below,
items 81 through 85 show again how more money is invested in charter
administration, leadership, and building expenses and less in charter school
instruction. This distribution
apparently varies state to state. In
Massachusetts, this is apparently not true based on the 11-6-16 article
“Schools That Work” posted in the NY Times about Boston charter schools. This article by David Lionhardt stated that Boston
charter schools “devote more of the resources to classroom teaching and less to
almost everything else.” If that is
true, it is the opposite of charter schools in Texas. (I wrote on 11-7-16 to Massachusetts education staff asking for similar data from
their state to compare charter funding of classroom instruction in
Massachusetts. No response received as of 12-10-16.)
This fast review only starts a conversation
about the 98 TEA Snapshot data items for 2014 and 2015.
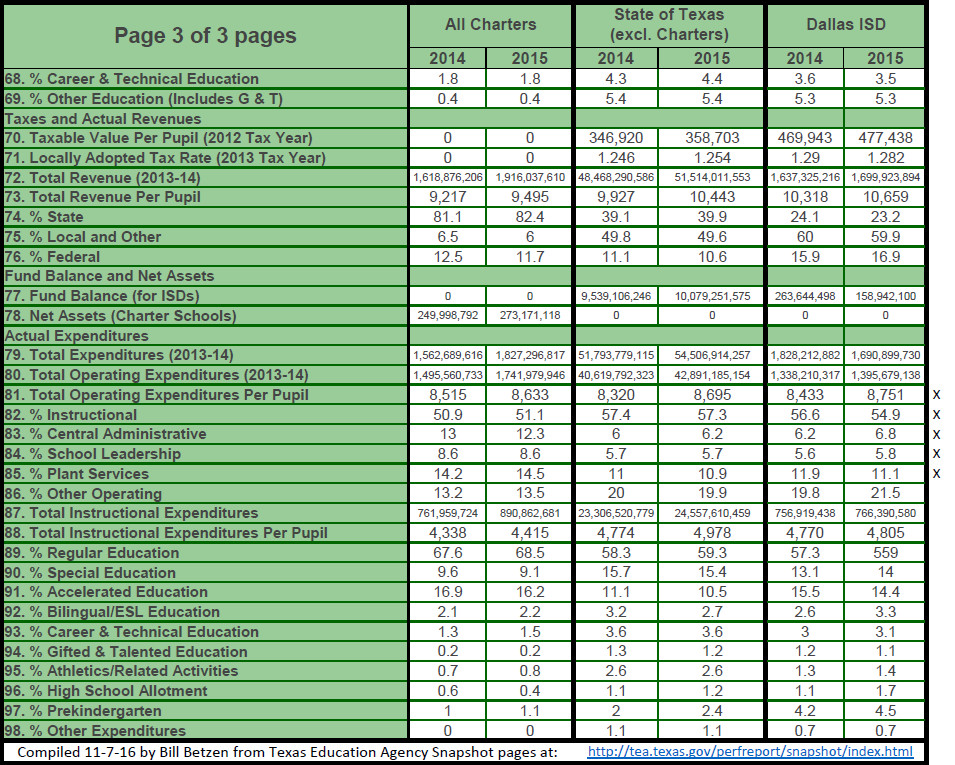 |
| Page 3 summary Texas Education Agency Snapshot Data for years 2014 & 2015 with Dallas ISD |
11-7-16, Bill Betzen