
Are Mike Miles and DISD treating Minority students the
same as White students?
Here are two spreadsheets tracking the percentage of DISD senior class students taking college entrance exams going back to 2007. They document almost constant increases in the percentages of students tested until 2013 when, for the first time, DISD paid for the SAT. The percentage of DISD students taking either college entrance exam went down! They only went down 0.5% for the SAT, but they went down 21.7% for the ACT!
When you separate students by race the 2013 changes are dramatic. While the percentage of Minorities taking the SAT saw almost no change, only a 0.1% increase, the percentage of Minority students taking the ACT went down 23.1%! That reversed a 5 year history of constant increases averaging over 17%. If only the same proportion of students as in 2012, with no increase, had taken the ACT, then 676 more Minority students would have taken the ACT in 2013. That did not happen.
With the normal annual increases, a total of over 1,000 more DISD Minority students would have taken a college entrance exam in 2013, but the numbers dived instead. What happened?
Email bbetzen@aol.com for a copy of either of these Excel Spreadsheets so you can check the data and formulas used in them. Below is the same spreadsheet as the 2013 ACT centered report above, but it contains the data from the 2013 SAT testing data:
The 23.1% reduction in the proportion of Minority students able to take the ACT exam represents a total of 676 minority students who did not have, for whatever reason, the advantage of taking the ACT. The 8.6% reduction in the proportion of White students able to take the SAT represents a total of 28 White students who did not have, for whatever reason, the advantage of taking the ACT.
In a search for the answer to questions about equal treatment for all students, it must be asked what could have caused the massive reduction in Minority testing as reflected in these charts. Are Minority DISD students being treated equally? What changed so suddenly? Was this an attempt to raise grade averages?
Also, why, for the first time in history, was the ACT average reported in whole numbers in all of the 2013 planning reports for all the schools? (See https://mydata.dallasisd.org/SL/SD/cdp.jsp .) Was this an attempt to give the perception of grades going from 17 to 18, a full point, when the real average changes were only 4/10th of a point, or from 17.2 for 2012 to 17.6 for 2013? Lessening the precision in these reports was certainly a step back in transparency.
Any claim that the 17.2 to 17.6 change is an improvement is erased by the 23.1% decrease in the percentage of Minority students tested.
What other questions need to be asked about these ACT/SAT testing patterns for 2013?
Here are two spreadsheets tracking the percentage of DISD senior class students taking college entrance exams going back to 2007. They document almost constant increases in the percentages of students tested until 2013 when, for the first time, DISD paid for the SAT. The percentage of DISD students taking either college entrance exam went down! They only went down 0.5% for the SAT, but they went down 21.7% for the ACT!
When you separate students by race the 2013 changes are dramatic. While the percentage of Minorities taking the SAT saw almost no change, only a 0.1% increase, the percentage of Minority students taking the ACT went down 23.1%! That reversed a 5 year history of constant increases averaging over 17%. If only the same proportion of students as in 2012, with no increase, had taken the ACT, then 676 more Minority students would have taken the ACT in 2013. That did not happen.
With the normal annual increases, a total of over 1,000 more DISD Minority students would have taken a college entrance exam in 2013, but the numbers dived instead. What happened?
 |
| ACT Testing History Dallas ISD 2007-2013 Click on above chart to enlarge and/or print |
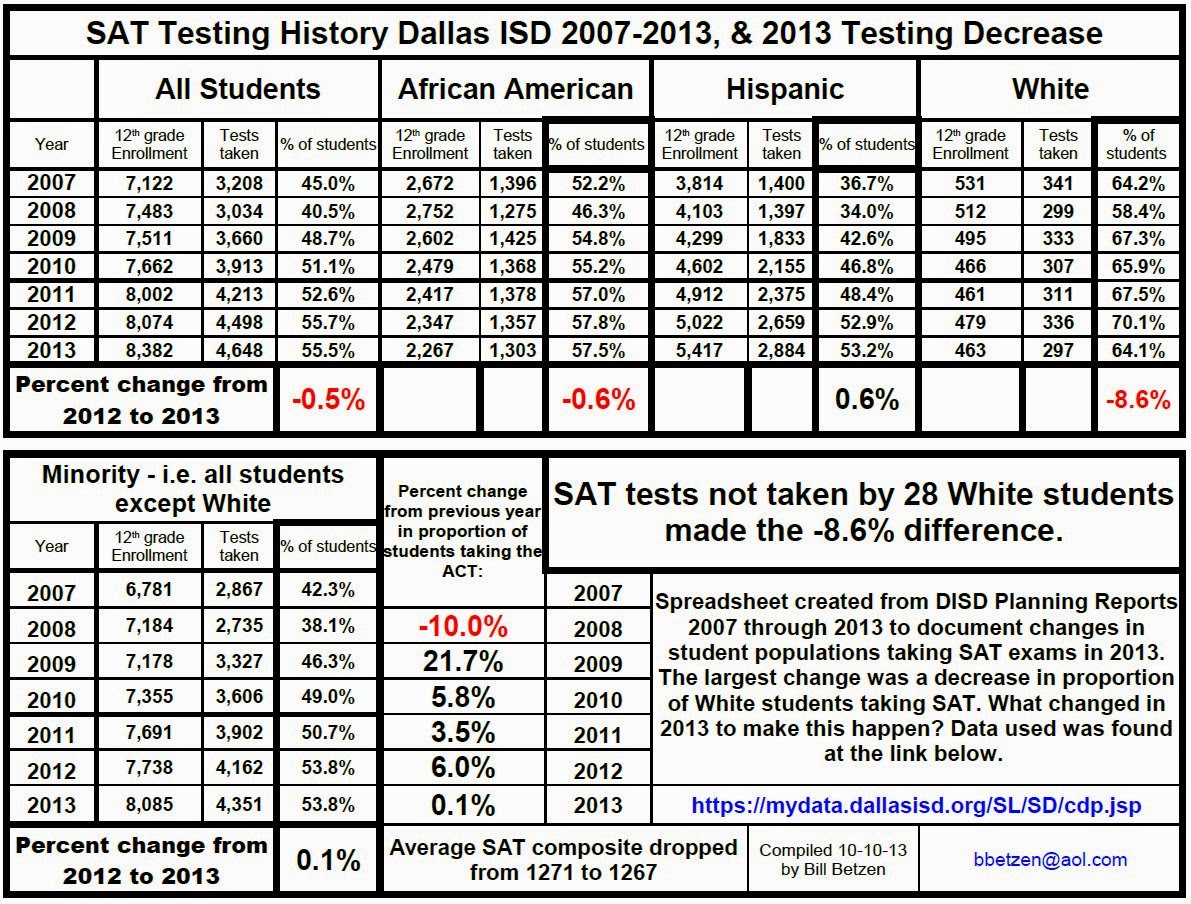 |
| SAT Testing History Dallas ISD 2007-2013 Click on above chart to enlarge and/or print |
In a search for the answer to questions about equal treatment for all students, it must be asked what could have caused the massive reduction in Minority testing as reflected in these charts. Are Minority DISD students being treated equally? What changed so suddenly? Was this an attempt to raise grade averages?
Also, why, for the first time in history, was the ACT average reported in whole numbers in all of the 2013 planning reports for all the schools? (See https://mydata.dallasisd.org/SL/SD/cdp.jsp .) Was this an attempt to give the perception of grades going from 17 to 18, a full point, when the real average changes were only 4/10th of a point, or from 17.2 for 2012 to 17.6 for 2013? Lessening the precision in these reports was certainly a step back in transparency.
Any claim that the 17.2 to 17.6 change is an improvement is erased by the 23.1% decrease in the percentage of Minority students tested.
What other questions need to be asked about these ACT/SAT testing patterns for 2013?